I'M BLOWN AWAY, WHAT REMARKABLE THINGS I SEE....
If you follow my posts you're aware of the fact that I put a lot of faith in the MJO (Madden Julien Oscillation) in developing long range forecast trends. The index, which tracks convective energy in the tropical Pacific, correlates its 8 different phases to temperature and precipitation trends for each month of the year. I can usually see pattern changes through the MJO before our modeling begins to sense it and show it.
Every once in awhile something will happen in our atmosphere that is so significant that it can over-power or off-set what the typical signals would show. This is one of those times. Let's start with the MJO which the EURO shows cycling through phases 4, 5, and 6 the remainder of January. During this time of year those are warm phases as you can see in the temperature analogs below. This would imply a couple of mild weeks ahead.

However, since way back in December a stratospheric warming has been taking place at the highest levels of the atmosphere centered near the North Pole. Temperatures there (at 10mb) have since warmed nearly 120 degree fahrenheit. You can see the warmth at 50mb encompassing the Arctic Circle below.

That forces the cold to move and it's on the way to the mid-latitudes and Midwest, over-powering what would normally be those mild MJO phases. One of the big drivers associated with this transition is the AO (Arctic Oscillation) and you can see how strongly negative it's forecast to go from late January through the entire month of February. Totally tanked.

Here's the temperature departures associated with the negative AO in January and February.

The long range modeling is now seeing the trend with these temperature departures on the GFS ensembles the next 2 weeks. Totally opposite of what the MJO analogs are showing.
Day 0-5

Day 5-10

Day 10-15

I can not emphasize enough the potential that exists for severe cold with the coming pattern. Just to give you a little eye candy this is what the GFS has for lows January 29th. If this were to verify it would set all-time records for cold in much of my area!

The wind chills for that period are insane. Flat out deadly! This is no guarantee but something close to this magnitude is certainly more than a pipe dream and would be just a brutal.

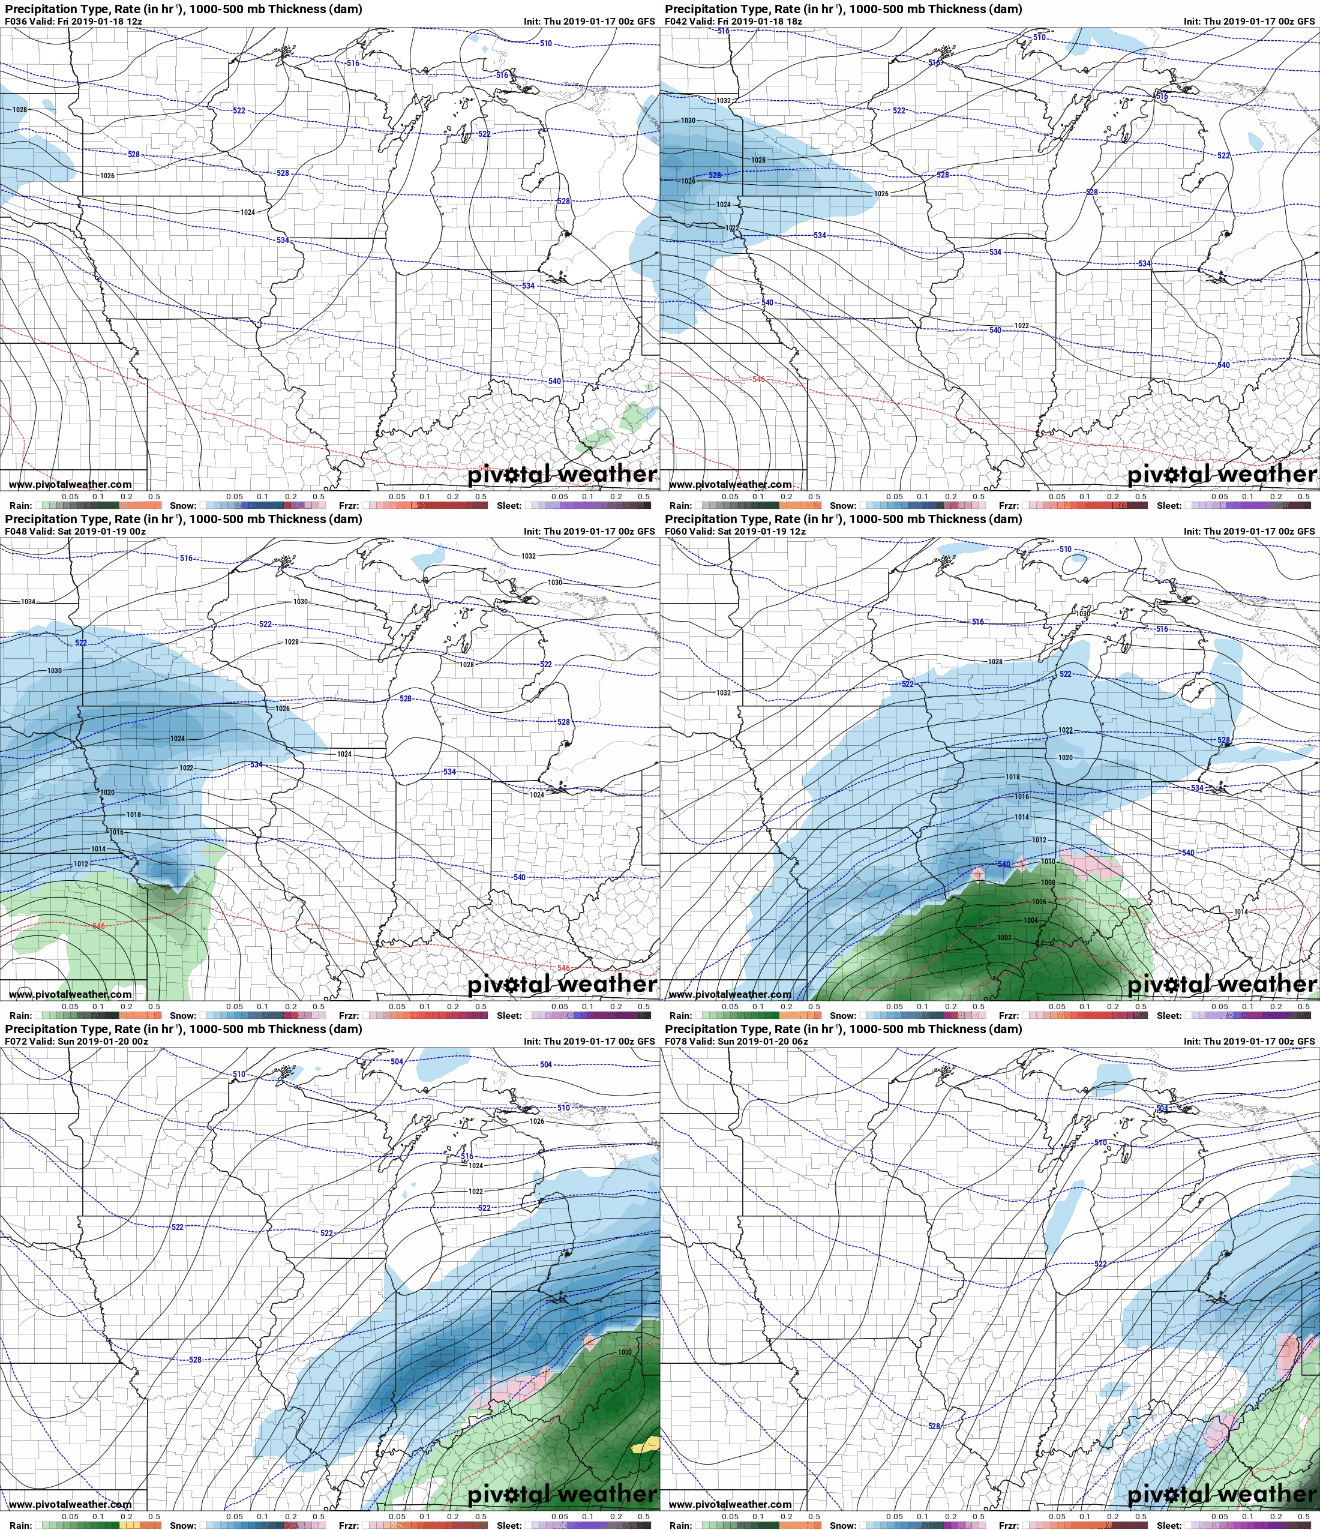
Now that I've made the case for cold let's take a look at the snow potential starting with Friday nights storm. You can see it rolling across the southern Midwest with snow to the north along with gusty northeast winds.

Snow totals are still looking pretty healthy thanks to the fluffy nature of the snow with ratios of more than 15:1. I do think the U.S. based models such as the NAM, GFS, and 3K NAM are way too wet and high. I do not expect amounts to reach their levels. For now I defer to the king (Sir EURO) and its totals. Take a look at the lot.
The EURO.

The regional EURO perspective.

The GFS

The NAM

The 3k NAM

The Canadian GEM

The EURO
Another snow maker is likely Tuesday so the threat of more heavy snow exists then. Too early to put out totals for that but I will show you some additional eye candy that speaks to the potential of snow in this pattern. This will not verify so don't even think about it. However, the trend points to plenty of snow with additional systems entering the Midwest the next 2 weeks. Don't think in any way this is a legitimate forecast. I am not trying to hype anything, this is just fun to look at if you like snow. I present to you the GFS 16 day snowfall forecast.

Wow, I'm just blown away. The gun is loaded! Roll weather....TS


