


A DECEMBER TO REMEMBER?
- Nov 22, 2025
- 7 min read
The last few Decembers haven't been much to write home about. On the whole, recent ones have been relatively mild and short on snow. Not like the ones I remember as a youngster in the 60s. Back then, even if we didn't have a lot of snow, we at least had cold. Maybe It's just my age, but the good old days seemed just a little bit tougher.
One fact that stands out the past decade or so is we rarely see a white Christmas. In the Quad Cities, only 3 of the last 14 Christmas days have had an inch of snow on the ground, (the requirement for it to be considered white). Since 2010, the odds have decreased to 21 percent. That's down from the historical average of close to 40 percent. The last white Christmas was in 2022 when a measly inch was measured. Before that, it was 2017 when a 2-inch depth was noted. As a guy who prefers to see white on Christmas, that breaks my heart as I approach my 70th trip around the sun.

I'm hoping this December will be one to remember, and I do feel we've got a decent crack with the MJO slated to pass through phases 7, 8, and potentially 1 in December. Those phases are what I call the holy grail of cold in the month of December. Straight up, if I'm looking for cold (which is necessary for snow), the cold phases of the MJO is the number one driver on my wish list. Add a relatively weak La Niña and a record November stratospheric warming, and that makes it 3 very positive signals in my favor.

I decided to take a deeper dive through AI (specifically chatgpt) to get its take on what December was like with MJO phases 7, 8, and 1 in play. Here's what AI came up. I've modified the content a bit to put a human imprint on it where necessary.
🌽 Midwest Winter Weather Patterns in December (MJO 7, 8, 1) — Since 1975
The Midwest region includes: MN, WI, IA, IL, MO, IN, MI, OH
These three phases typically occur consecutively and are known for driving colder North American patterns, especially in early winter. Overall, 7 → 8 → 1, as a sequence is one of the most winter-favorable December MJO progressions for the Midwest going back to 1975.
1️⃣ Phase 7
Temperature (since 1975)
Below normal across most of the Midwest
Greatest cooling signal in: MN, WI, MI, IA, IL
Snowfall
Noticeable snowfall uptick in:
Upper Midwest (MN/WI/MI)
Western Great Lakes
Increased clipper activity from Alberta
Early-season Arctic fronts more common
Synoptic Pattern
Ridge near Alaska
Trough from Great Plains to the Great Lakes
Stronger northwest flow = cold shots + clippers
Frequency of cold Decembers in MJO phase 7 since 1975: 70%
2️⃣ Phase 8
December Phase 8 is one of the coldest Midwest phases over the past 60 years.
Temperature
Strong below-normal temps across:
MN, WI, IA, IL, MI, IN, OH
Some of the coldest anomalies occur around:
Chicago
Twin Cities
Milwaukee
Quad Cities
Des Moines
Snowfall
Above-normal snowfall in:
Upper Midwest Great Lakes (lake-effect, often enhanced)
Great Lakes (lake-effect, often enhanced)
Increased odds of:
Panhandle-hook systems
Colorado lows
Synoptic snowstorms tracking toward the Ohio Valley
Synoptic Pattern
Deep trough over eastern U.S.
+PNA ridge over the West
Arctic intrusions are common
Active SW-to-NE storm track favoring Midwest snow events
Frequency of snowy Decembers in MJO 8 since 1975: 60–70%
3️⃣ Phase 1
Temperature
Moderately below-normal across:
Midwest (especially Great Lakes)
Pattern tends to be less extreme than Phase 8 but still favors cold
Snowfall
Above normal in:
MI, WI, OH, IN, IL, IA
Enhanced lake-effect continues
Synoptic storms often track through MO → IL → IN → OH or through IA → WI → MI
Synoptic Pattern
Persistent trough in Eastern U.S.
Jet stream positioned to favor:
Midwest snowfall
Great Lakes storm development
Frequency of snowy Decembers in MJO 1 since 1975: 55–60%
📊 Midwest Summary (1975–2024)
MJO Phase | Temperature Signal | Snowfall Signal | Midwest Comments |
7 | Cold | Slight ↑ | Clipper-heavy, frequent cold fronts |
8 | Very cold | Strong ↑ | Stormiest/snowiest, strong blocking |
1 | Cold | Moderate ↑ | Lake-effect + synoptic systems |
🌡Which phase has the strongest Midwest impact?
1️⃣ Coldest: Phase 8
2️⃣ Snowiest: Phase 8
3️⃣ Most clipper activity: Phase 7
Quad Cities–December MJO Impacts Since 1975
Below you can see what to expect in a typical 7, 8, 1 December MJO cycle in the immediate Quad Cities. Note that phase 8 is labeled "the big one" pattern for both cold and snow.
1️⃣ MJO Phase 7 — “Clipper Cold” Pattern
Temperature
2–4°F below normal on average
Frequent cold fronts and dry Arctic air masses
A lot of windy, cold, but not deeply frigid days
Snowfall
Near to slightly above normal (+0 to +2 inches)
Most snowfall comes from:
Alberta clippers
Light overrunning events
Big snowstorms are less common in this phase
Summary
Phase 7 = colder, drier snow, modest accumulations, but reliably wintry.
2️⃣ MJO Phase 8 — “The Big One” Pattern
This is historically the coldest and snowiest December MJO phase for the Quad Cities.
Temperature
4–8°F below normal
Many years show arctic outbreaks, with multiple days in the teens or single digits
Very strong –AO / –NAO teleconnections show up here
Snowfall
Significantly above normal
Typical anomaly: +3 to +6 inches
Some Phase-8 Decembers doubled normal totals
Most enhanced snow years since 1975 occurred with Phase 8 episodes
Storm Tracks Favored
Colorado lows
Panhandle hook systems
Tennessee/Ohio Valley lows wrapping snow into IA/IL
These are the systems that bring 4–10"+ events to the QC region.
Summary
Phase 8 = very cold, stormy, and strongly snow-favored.
3️⃣ MJO Phase 1 Pattern
Temperature
2–5°F below normal
Not as extreme as Phase 8, but still solidly cold
Persistent troughing keeps highs often in the 20s
Snowfall
Moderately above normal (+2 to +4 inches)
Mechanisms:
Synoptic storms from Missouri/Illinois/Iowa corridor
Lake-effect “backwash” moisture into eastern Iowa after cold fronts
Summary
Phase 1 = cold, steady snow events, good for seasonal totals.
By the way, phase 8 has a better than 50/50 chance of a 6 inch or greater snowfall in the Quad Cities.

Something else that is intriguing to me is that one of the strongest analogs for this December's weather is December 1983. At 50mb, high up in the stratosphere, temperatures near the North Pole are shown warmer relative to average than anywhere in the Northern Hemisphere. Typically, it's the opposite, with cold focused on that area.

This year about that time, you can see the 50mb anomalies below are extremely similar. That's the stratospheric warming I mentioned that is at record levels for November. This slows the intense wind circulation around the polar vortex and can actually reverse it. With 50mb winds substantially reduced, the cold air has an enhanced chance of being displaced much further south into the U.S. This opens the door for Arctic air to potentially bull rush the Midwest.

Anyway, my point is this that because ot this,1983 has become a strong analog that's heavily weighted for what "could be" this December. Below are the December 1983 departures, the all-time coldest on record for many in this area. That's ominous, but a worst case scenario.

By the way, 1989 is also quite similar to 1983 and is also a serious analog. Here's the combined December temperature departures for those two years, and it is downright ugly. The big difference between the two was 1983 was cold and snowy. 1989 was frigid but with far less snow.

In a nutshell, there is lots of potential for a December to remember when you look at all the players on the field. How they perform is another issue, and that part of the story remains to be told. However, I think odds are very good December temperatures end up below normal and snowfall ends up near to above normal. Where we are in relation to the storm track (a big unknown) will determine how snowy it ends up.
GIVE THE GIFT OF MY 5 STAR AIRBNB IN GALENA

Holiday and winter specials are now in effect through March. Let us help you set up a personalized gift certificate that's sure to create a lifetime of memories! Santa Claus approved. Call or text Carolyn at 563-676-3320 for details and our very best pricing. https://www.littlewhitechurchgalena.com/
ON THE ROLLER COASTER
As far as sensible short term weather goes, we haven't even gotten out of phase 6 of the MJO yet, which is known for being mild and living up to its reputation. With Friday's system gone (after producing some needed rain in the far south), drier air finally makes a run at the region this weekend. Not only will it look better, it will feel better, with highs reaching 50-56 Saturday and 52-58 Sunday from north to south.
After the weekend it's adios nice weather as a rain system kicks out of the southwest bringing clouds and rain back to the region by late afternoon with highs mainly in the upper 40s to low 50s. It shifts quickly northeast and should be out of the area by Tuesday morning. That's followed by a lull until later Tuesday afternoon, when a stiff cold front wings its way southeast. A few showers are possible in the north as it passes. The bigger concern will be the strong NW winds and the colder air that it delivers. After highs in the low to mid 50s Tuesday, readings will crash into the low to mid 30s Wednesday and Thanksgiving Day. It will be cold but from the looks of things, dry weather prevails for holiday travelers Wednesday through Friday.
There is a chance of snow (or mixed rain or snow) Saturday, but models are struggling to determine the specifics. Accumulations are most likely in the NE half, if they happen at all. Right now, preliminary amounts range from 1/2 inch to as much as 2 inches.
Beyond that, a sizable system sets up Sunday and Monday that tracks to the west. That pulls enough warm air into the region for precipitation to fall as rain. Details are still in flux, so some alterations are possible and that will be worked out in coming days. This big takeaway is that we are into phase 7 by then, and the pattern change that will shape December is starting to unfold.
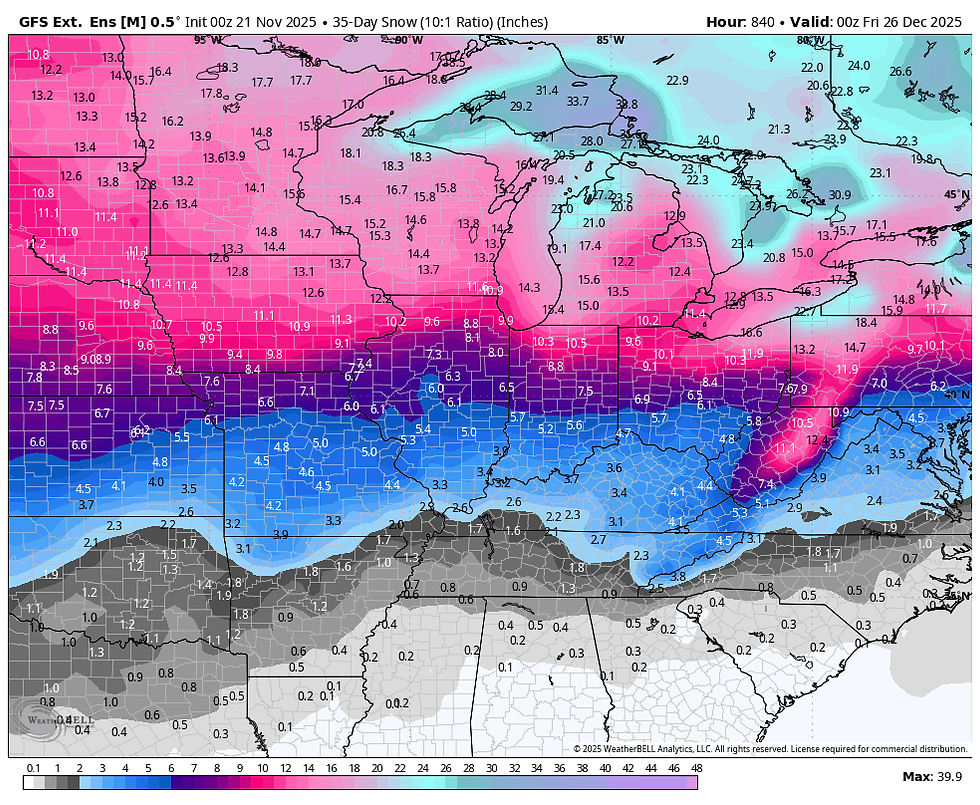
As I've been doing the last couple of weeks, here are the ensemble mean snowfall totals for the EURO and GFS through Christmas.
The EURO

The GFS
These are the 30 day average temperature departures November 30th to December 31st.

I got a bit carried away today but there is so much weather on the table that I find myself heavily emersed in challenges presented. Thanks for hanging with me and I hope you learned a little something, something. Roll weather...TS
TSWAILS.COM expert weather consulting services (CLICK FOR MORE)

Private consulting
Legal forensic services as an expert witness
Public speaking engagements for groups or individuals
Post storm analysis
A private day-long weather school class
Specialized events forecasts
Severe weather seminars
Lectures and training
Climatological services
Meteorological workshops.


Comments