PLAYING WITH THE EMBERS OF A FIRE...
- terryswails1
- Jul 23, 2021
- 5 min read
We are rapidly coming up on the anniversary of last years derecho which remains the costliest thunderstorm in U.S. history. The severity of the storm and and its 11 billion dollar damage tab is one of the reasons the NWS is making an important change to its warning system. Starting August 2nd, severe thunderstorm warnings for baseball-size (or larger) hail and/or 80 plus mph winds will activate a Wireless Emergency Alert (WEA) on smartphones. This is to heighten awareness of "destructive" thunderstorms. The approach is currently used only for tornado and flash flood warnings.

On average, only 10 percent of all severe thunderstorms reach the destructive category each year, nationwide. Most of these storms are damaging wind events such as derechoes and some of the larger, more intense thunderstorms, called “Supercells” that can typically produce very large hail in their path. The new destructive thunderstorm category conveys to the public urgent action is needed, a life-threatening event is occurring and may cause substantial damage to property.
Thirteen of the 22 costliest weather disasters in 2020 were severe thunderstorms. The new “destructive” tag would have activated a Wireless Emergency Alert for many of these impactful events, including the costliest thunderstorm in U.S. history, the $11 billion derecho that affected Iowa in August 2020.

Last year alone there were 22 separate billion-dollar weather and climate disasters across the United States, shattering the previous annual record of 16 events, which occurred in 2017 and 2011. The billion-dollar events of 2020 included a record 7 disasters linked to tropical cyclones, 13 to severe storms, 1 to drought, and 1 to wildfires. The 22 events cost the nation a combined $95 billion in damages.
Adding the 2020 events to the record that began in 1980, the U.S. has sustained 285 weather and climate disasters where the overall damage costs reached or exceeded $1 billion. (All cost estimates are adjusted based on the Consumer Price Index as of December 2020). The cumulative cost for these 285 events exceeds $1.875 trillion.

The billion-dollar disaster events during 2020 caused $95.0 billion in damages (red line below), which is the fourth-highest inflation-adjusted annual cost total since 1980, and more than double the 41-year average of $45.7 billion. The costliest 2020 events were Hurricane Laura ($19 billion), the Western wildfires ($16.5 billion), and the destructive August derecho ($11 billion).
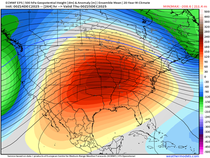
The biggest issue on our weather plate short term is determining the heat that's coming this weekend and its intensity and duration next week. Without a doubt Friday and Saturday will be steamy as we play around with the fire of an intense heat dome to the west. We don't get into the core of it but we will see temperatures reach 90 both days, perhaps 92-95 Saturday. Dew points will also be in the low to mid 70s and that will ratchet up the heat index. Saturday is going to be the worst of the two days with the 3k NAM showing some nasty heat index values of 105+. At a minimum that would produce heat advisories. I do wonder if the 3k may be a bit high in dew points but even at the low end the heat index should hover near 100.

The next order of business is a weak front which is forecast to drift through the area late Saturday into Saturday night. The issue here is whether or not it can generate enough forcing to break the strong CAP that's in place due to very warm air aloft. One thing is for sure, the atmosphere is loaded with instability with CAPE values near 5,000 j/kg.

If anything can bust through the CAP some robust updrafts are likely with the ability to produce wind and torrential downpours. Most models are not very excited about the prospects but that's a wild card for Saturday night that needs to be monitored.
After the front passes, Sunday remains very warm but less humid so we'll notice some improvement, especially across the north.
Next week and into the following weekend there are some significant differences between the GFS and EURO on the intensity of the heat and its overall duration. I'm going to show you the meteograms of the two models and the highs they project long term. I'll start with the EURO which is very bullish in prolonged heat. It's 10 day average high Friday the 23rd through Sunday August 1st is nearly 95 degrees. It also has a 100 degree day.

The GFS is far more tolerable with an average high over the same period that comes in at 89 degrees.

I'm still troubled by the EURO being so hot when its MJO is not in a warm phase. I've included the MJO forecasts of the EURO and GFS side by side and both are going through phase 6.

It's pretty clear to see that phase 6 is not known for being warm in July.

Clearly the MJO forecasts of the models are are out of sync with their deterministic output. Maybe they haven't caught up with the MJO which often sees trends before the model output latches on to it. Perhaps a short wave will amplify or buckle the flow more near the Great Lakes and back the heat up on occasion? That is what the GFS implies with its cooler 10 day readings. If a stronger short wave enters the picture that might produce an even cooler outlook than the GFS indicates that is closer to the MJO analogs. My take is that the EURO is just too hot and I am leaning towards the more moderate GFS.
The way it looks to me now is that there is going to be a surge of heat this weekend and then it may back down with lower dew points Sunday-Tuesday (more like what the GFS is showing). Midweek another quick surge of heat and humidity arrives with a cool-down the end of the week. That's followed by another shot of heat a couple days later. It's what I would call a push pull pattern on the periphery of the heat dome which is closer to what the MJO is signaling. I will say the MJO is not as strong a driver in mid-summer as it is in winter so this will be a good test to see its summer value. We shall know soon enough.
As for rain, I think the chances are pretty meager through at least Monday, maybe Tuesday of next week. The GFS my model of preference at this point shows this for rain totals through Monday.

Meantime, the weekend gets of to a toasty start as we play around with the embers of fiery heat wave just to our west . Roll weather...TS


Comments