


SOME SERIOUS EYE CANDY...
- Jan 3
- 6 min read

The definition of eye candy is a visual image that is superficially attractive and entertaining, but intellectually undemanding, (in other words, easy to understand). Almost everyday I look at weather charts that are, for a lack of a better term, "exciting" in the type of weather they depict. However, I (or anybody worth their salt) won't put them up because the chances of verification is so low. It's hard enough to get it right 3 days out, let alone 2 weeks or a month later. That's where you can get into serious misinformation. However, I do feel there are instances where when used in the proper context, eye candy can yield big picture value to long range trends, but in terms of specific details such as timing, strength, and essential mesoscale features, forget about it.
So, in this post I am putting up the meteograms of the GFS and EURO that show projected temperatures for the next 2 weeks in the Quad Cities. In this case, I'm focused on high temperatures and nothing else. It's not the sexiest eye candy, but what's shown is pretty darn impressive considering we are going into the coldest time of the year, with average highs in the mid to upper 20s in many areas. When I look at a meteogram, I'm not focused on the specific numbers, chances are none of the days will hit exactly. Still, that's not a problem as long as we are within 2–3 degrees. What I'm searching for are hard trends. For something different, I'm going to make this an interactive post. Take a look at the meteogram below and think about what stands out to a forecaster like me. I will comment below.
The EURO

The obvious take-away is wow, that's warm by January standards. It takes about 3 seconds to figure that out. Upon closer inspection, I notice there are 7 days at least in the 40s and 1 in the 50s. Knowing the normal high is 29, your next assessment should be that there are 14 days starting Sunday when readings are well above that level. In fact, a closer inspection reveals a 14-day stretch where highs remain at or above freezing. Now as a forecaster, I'm thinking that is impressive and there is nothing normal about that. Many of these days are 10-20 above the average of 29.
The next thing I think is okay, I'm solid with the idea of the warmth for about 7 days. Then I think, what about the following 7 days. It's common knowledge that the further out in time you go, the more skill scores go down. Could a cold front sneak in day 10 or 11 and suddenly put an end to the mild readings. That's a legit concern and something that gives me pause, a potential bump in the road that needs to be watched after day 10.
With that in mind, the next thing I do is look for consistency. Is the EURO out on a limb compared to other models, or are they in agreement in showing a similar trend. I go to the GFS for comparison and I get this.

Not only does the GFS have a similar trend, it's even warmer at its peak. It's got 11 days in the 40s and 50s, with one at a whopping 62. The run shows 15 consecutive days with highs above freezing. Two thoughts about that. One, 55 to 62 in January is a feat that's very hard to accomplish on a single day, let alone 5 consecutive days. That's a red flag and leads me to think that it's too warm and that the EURO is more realistic. Secondly, I'm reminded that about 50% of the days are 20–30 degrees above the normal of high of 29. That's really quite spectacular and rare. Is that even attainable? Probably not to that extent.
My next thought it is just how rare is this? Have we even had anything similar to this? I went to ChatGPT and asked for the longest January streak of highs 32 or greater in Moline. I asked for the official Moline data, since records at the NWS office in Davenport have only been kept since the mid-90s. Anyway, I was surprised to see that the longest streak is 24 consecutive days, back in 2006. That blows away the potential 15-day streak shown on the GFS. What's more, I don't even remember the 2006 warmth, and I lived through it working a KWQC at the time. (I assume I was so traumatized that my mind tried to block it out).
Longest January streak with daily highs ≥ 32°F
Moline, Illinois (NWS official record)
🏆 24 consecutive days
January 2 – January 25, 2006
This is the longest uninterrupted January stretch on record at Moline, where every daily maximum temperature was at or above freezing (32°F).
🔍 Details (NWS-verified)
Location: Moline / Quad Cities (MLI)
Data source: NWS Davenport (CLI / CF6 daily climate data)
Criteria: Daily maximum temperature ≥ 32°F
Streak length: 24 days
Start: January 2, 2006
End: January 25, 2006
Break: January 26, 2006 (high of 30°F)

No other January in the official Moline record equals or exceeds this length without at least one sub-freezing high interrupting the run. 3 other years had streaks of 18–21 days going back to 1878. They are shown below.
🥈 Other notable long January runs (for context)
Year | Dates | Length |
1932 | Jan 6–26 | 21 days |
1981 | Jan 3–22 | 20 days |
1878 | Jan 7–25 | 19 days |
1998 | Jan 10–27 | 18 days |
All of the above were confirmed using NWS daily max temperature data, but none surpass 2006.
🌡️ Why January 2006 stands out
Strong Pacific flow off the Pacific
Persistent lack of snow cover
No Arctic intrusions for the entire month
Monthly mean temperature among the top 3 warmest January's in Moline history
FLASH SALE THIS JANUARY

A January weekend, (4 GUESTS FOR $499) My AIRBNB outside of Galena is ready and waiting. Enjoy our unique, fully renovated church. It's an AIRBNB guest favorite with 5-star reviews. Warm and cozy, even in the winter. Minutes from Galena. Call or text Carolyn at 563-676-3320 for details about this very special deal. https://www.littlewhitechurchgalena.com/
THE LONG AND SHORT OF IT...
Well, looking at the 10-day temperature departures, confidence remains moderate to high that we are in for a prolonged period of temperatures at or above freezing for at least the next 10 days, taking us out to January 13th. The EURO shows daily 10 day temperature departures that look like this, January 5 through the 15th.

The GFS 10 day departures for the same period also show the blow torch.

Below are the pressure anomalies for January 8th. What you can clearly see is an over-abundance of low pressure across North America. The colder the air is, the higher the pressure associated with it. Pressures are low over much of the continent, indicating a lack of cold dense air. It goes to figure, until that changes, we remain on the warm side of the ledger.

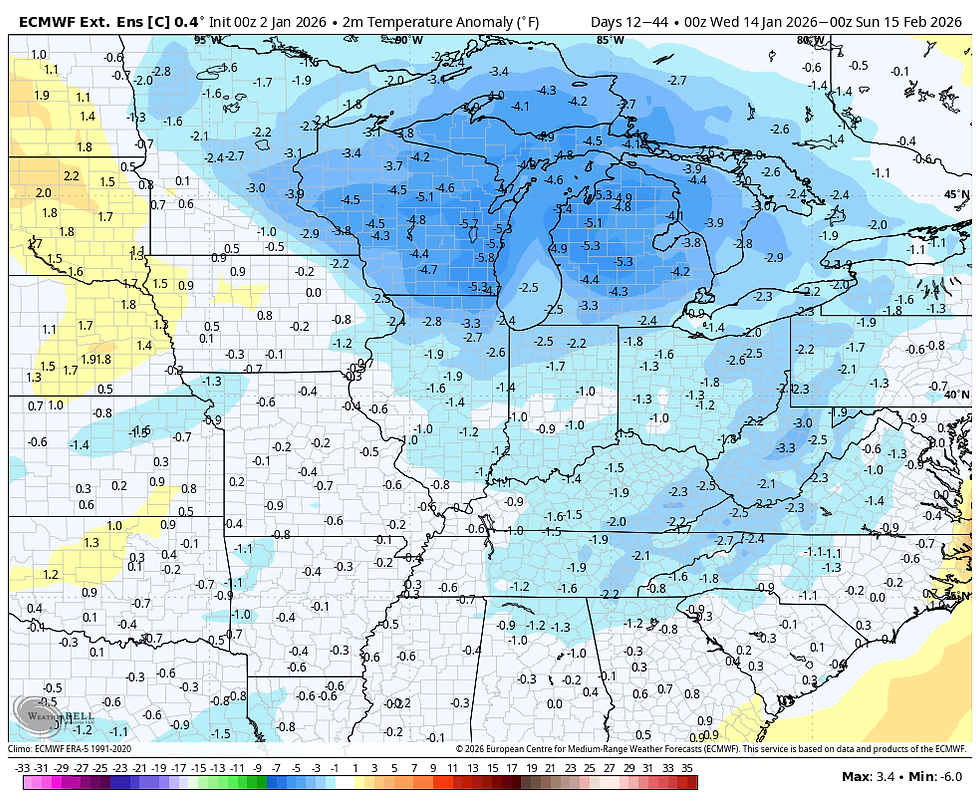
Speaking of a change, yesterday, the EURO weekly control showed 30 day temperature departures that looked like this, January 15 through February 15th. That was the 5th consecutive day of that trend.

Today, while there remains a trend towards below normal temperatures, the numbers are not nearly as cold locally as 24 hours earlier.
One can see that pressures are substantially higher around the 18th, which in itself indicates the return of colder air to the pattern.

In fact, the 500mb flow the 22nd is highly amplified on the control the 22nd. It remains to be seen if anything remotely like this occurs, but that is true eye candy for an Arctic outbreak. This time frame has been consistently hinted at for significant cold, and that configuration would do it.

30 day snowfall on the control for the 6th consecutive day remains plentiful. Most of what shows here falls after the 20th, a long ways away, which of course lowers confidence. Still, there is value in the fact the trend has been consistent for nearly a week.

Short term, I don't see much to get excited about in regard to precipitation Saturday through at least Thursday of next week. And of course, we've discussed temperatures in depth and how they get above freezing Sunday and stay that way for the foreseeable future. Looks like we must be living right! Have a great weekend and roll weather...TS


Comments