


THE STAKES ARE HIGH IN DECEMBER...
- Nov 15, 2019
- 4 min read
Today was the 4th consecutive day in Cedar Rapids with the temperature not getting out of the 20s. Halfway through November the month would come in as the 2nd coldest on record just behind 1959. That year the average temperature for the entire month was 27.9 degrees. This year with 2 weeks to go we are at 28.1 degrees, just ahead of 1976.

This graphic shows all the average temperatures for November in Cedar Rapids since 1959. You can see the 3 coldest years as well as the warmest which was a very toasty 47.8 degrees in 2001.

I also thought this was a telling graphic. Since October 11th in Cedar Rapids, 32 of the past 35 days have been below normal...throw in Friday, 25 of the last 26 days will have that distinction.

Slowly this massive area of high pressure and its cold air is shifting east. You can see tomorrow the ridge axis is far enough east that we can start to get southerly winds and slightly warmer air to ease into the Midwest.

You can also see the jet flattening out Saturday allowing the moderation.

Unfortunately it doesn't stay flat for long as the next short wave buckles it again and by Monday we are back to this at 500mb.

Even though readings will be higher, existing snow cover will be a detriment to any warming where it remains. It looks now like highs will range from the mid 30s to mid 40s over the weekend, warmest south of I-80. Some light showers or drizzle is a possibility by Sunday. Overall temperatures the next 5 days will remain below normal, although a good 5-10 degrees warmer than they have been.

Last night I had a big post talking about the EPO (eastern Pacific Oscillation) and how despite the MJO being in cool phases the EPO was projected to move into positive territory. That bugged me since the teleconnections were at odds with the temperature correlations. I have noticed recently that the EPO has been very reliable showing the cold since way back in early October. During this wicked stretch of weather both the GFS and EURO ensembles have shown a healthy negative phase of the EPO which is a strong indicator of cold. I was mystified why the EPO was shown going so positive when the MJO was in cold November phases. What was the driver?
Well today I'm feeling a bit better as the EURO ensemble instead of being positive is generally negative from the 18th through the 29th.

The GFS ensemble has really reversed itself and goes deeply negative after flirting with the positive phase for a short period of time. Not sure about that.
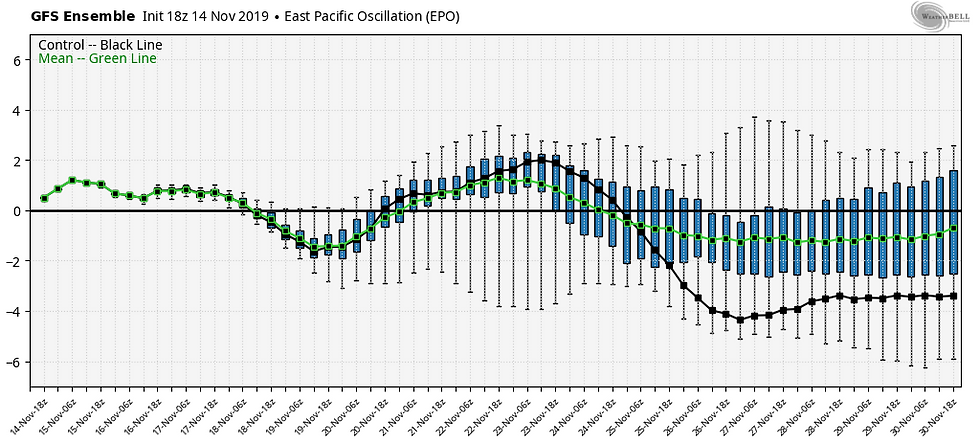
There's a lot of flip flop going on and my belief it that the models are really struggling with the pattern. What I'm thinking (and I mentioned this last night), is that we should have a period of about 6-10 days where readings will be more seasonal and then the warm north Pacific water could force the west coast ridge back up and open the door to the potential of more cold air...maybe!
Adding some confidence is the new EURO weeklies. The control came in much colder than in previous runs and for the next 46 days (basically the rest of the year) it shows this for temperature departures. This model has had trouble seeing cold air in the long range so this is a bit of an eye opener.

The weeklies do fall in line with my thinking and it may be a signal that we get back to into winter again by early December. Of course I can't say that with full certainty but the ingredients are there for it to happen and it mirrors the trends already established. As you can see, I'm just kind of feeling my way through this right now.
While I see no snow systems in the near future the weeklies are also extremely bullish on that potential entering December. This is the EURO control's 46 day snowfall output. Don't take the specific numbers too seriously, it's the trend that's important and let me tell you this is an aggressive snowfall forecast. First the U.S. view.

Same map for my local area.

Another perspective for my friends further west.

This is a challenging period of forecasting coming up as we recharge and realign the atmosphere. I'm very anxious to see how my vision plays out. The stakes are high. This is the territory where the big boys play and I'm not sure I belong there. Happy Friday and roll weather...
PLEASE CONSIDER WHAT YOU'RE GETTING...
I hope you are aware of how far ahead of the competition TSwails has been in catching the trends of our early winter weather pattern. It takes a heck of a lot of commitment, passion, and knowledge to do that. This is now my job and that's why I'm asking for a voluntary subscription fee of $12 dollars a year, one dollar a month to keep TSwails going. Together we can create one of the best, most unique, and reliable weather sites in the Midwest. Your contribution of 3 cents a day, allows me to stay free of the corporate world and pour my energy into doing what I do best, forecasting the weather! We hope you see the value and hard work that goes into the site everyday. You support in any way is sincerely appreciated. Thanks and roll weather. To donate click on the secure green box below.


Comments