JUST WHEN YOU THINK YOU'VE TURNED A CORNER...
This past weekend is behind us but I need to remark on it because it was "remarkable". Highs in the 80s and even the 90s covered the central Midwest. Spencer in NW Iowa peaked at 97 Saturday afternoon. The combination of high temperatures and low dew points were unprecedented. Since records on such things were established, there has never been a May 1st where Estherville, Mason City, Spencer, and Waterloo were all so warm and dry. Temperatures in all those cities were in the 90s with dew points in the 30s. Proof positive that dry air does heat up, especially with SW winds gusting 40-50 mph. Thanks to the Iowa Mesonet for the info below.

One of the reasons for the extremely dry air was the lack of rainfall in much of Iowa leading up to the event. April was the driest in 129 years of records in NC Iowa. NE and Central Iowa had their 2nd and 3rd driest respectively.

That led to abnormally dry to severe drought conditions across much of the Iowa. The dry soils heat more quickly and don't contribute available water to transpire into the atmosphere and boost dew points.

So it is good news that rain did fall Sunday night an Monday around much of the region. However, it had a tendency to be banded in nature and while some spots picked up more than an inch, other locations not far away came in with amounts that were substantially less. In most cases, anything that fell was welcome and helped settle the dust. This is the Davenport Doppler estimates from Monday's rain. Note the bands of heavier rain I talked about.

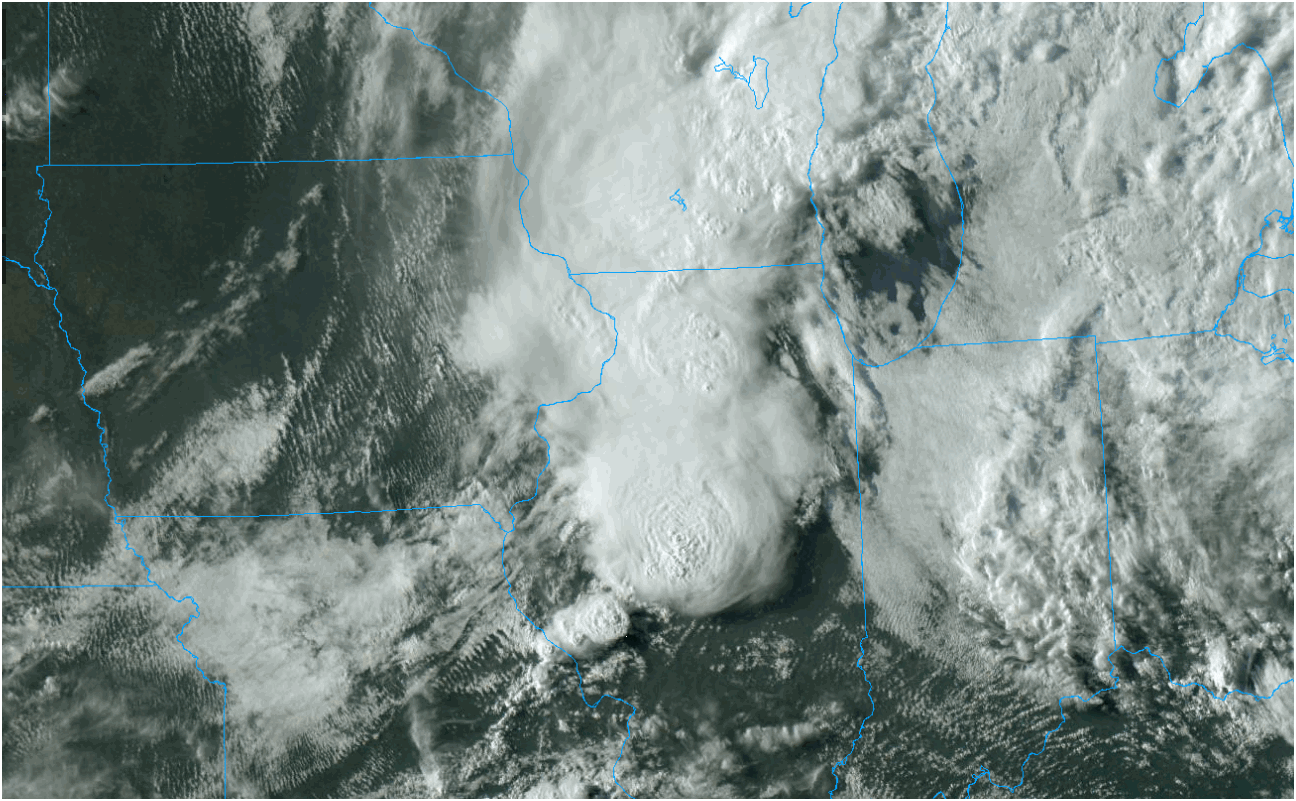
Here's a pair of satellite images from Monday. The first showing some potent storms blowing up in Illinois. The other a composite depicting clouds and precipitation early Monday evening just clearing the Mississippi.


Switching gears, this is the news I've been anticipating and dreading for over a week. All that summery air we enjoyed is going by the wayside and the pattern will be one of below normal temperatures for the foreseeable future. This is what the GFS shows for readings the next 16 days. For 14 consecutive days it indicates highs below normal (2 whole weeks). 7 of the days have highs only in the 50s. That's pretty sad and is actually quite hard to do at a time of year when the sun is very powerful. (Did you realize the days start getting shorter in just over 7 weeks!

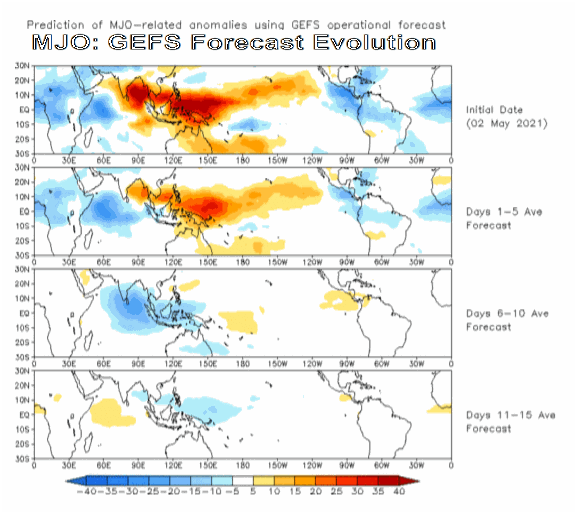
This change has been hinted at for more than a week (as I've indicated on several occasions) by way of the Madden Julien Oscillation. The MJO measures the progression of convective energy in the tropical Pacific centered on the region near the Indian Ocean. The location of the convection within that region is tracked through 8 different phases of the MJO. Each phase has a North American monthly temperature and precipitation correlation for that specific month.
By measuring outgoing radiation from satellites we can determine where clouds and precipitation are along with the overall intensity of the convection. Observing and tracking the trends of the MJO is a great way to get a jump on long range changes in the pattern which models are slower to adapt to.
Below you can see the differences in measured radiation tied to clouds and precipitation throughout the Indian Ocean. These are laid out in 5 day increments from the initial measurement until the end of day 15. Notice how the red colors near India and SE Asia are replaced by blue ones by the end of the 15 day period. That's the MJO moving out of the warm phase 8 we just enjoyed into the cooler phases of 1, 2, and 3.

This is the MJO phase diagram which is divided into 8 phases. The dotted green line is the mean forecast going out to May 17th. The yellow lines are ensembles with some members more amplified than others. The mean smooths out all the extremes which are most likely outliers. On the right are the temperature analogs that phases (1, 2 and 3) likely to bring in May. Way too much of that cool blue for my liking.

Two other key teleconnections that point to cool weather are the Arctic oscillation (AO) and the Eastern Pacific oscillation (EPO). Both are going into negative phases which also correlates to below normal temperatures. That certainly leads to high confidence the next two weeks wont see any of those balmy readings we just experienced.


Additionally, the ensembles and deterministic models are now all seeing the chill and the GFS indicates temperatures that look like this out 15 days in 5 day increments.
Days 0-5

Days 5-10

Days 10-15

As for precipitation, that tends to be near to below normal in phases 1and 2 of the MJO but does pick up in phase 3. Personally, I think the end of May and start of June are going to be active, wet and potentially stormy with a big increase in severe weather. Short term, the bulk of storms and tornadoes are going to be confined to the south where things could really get hopping the next 10 days. Roll weather...TS


